


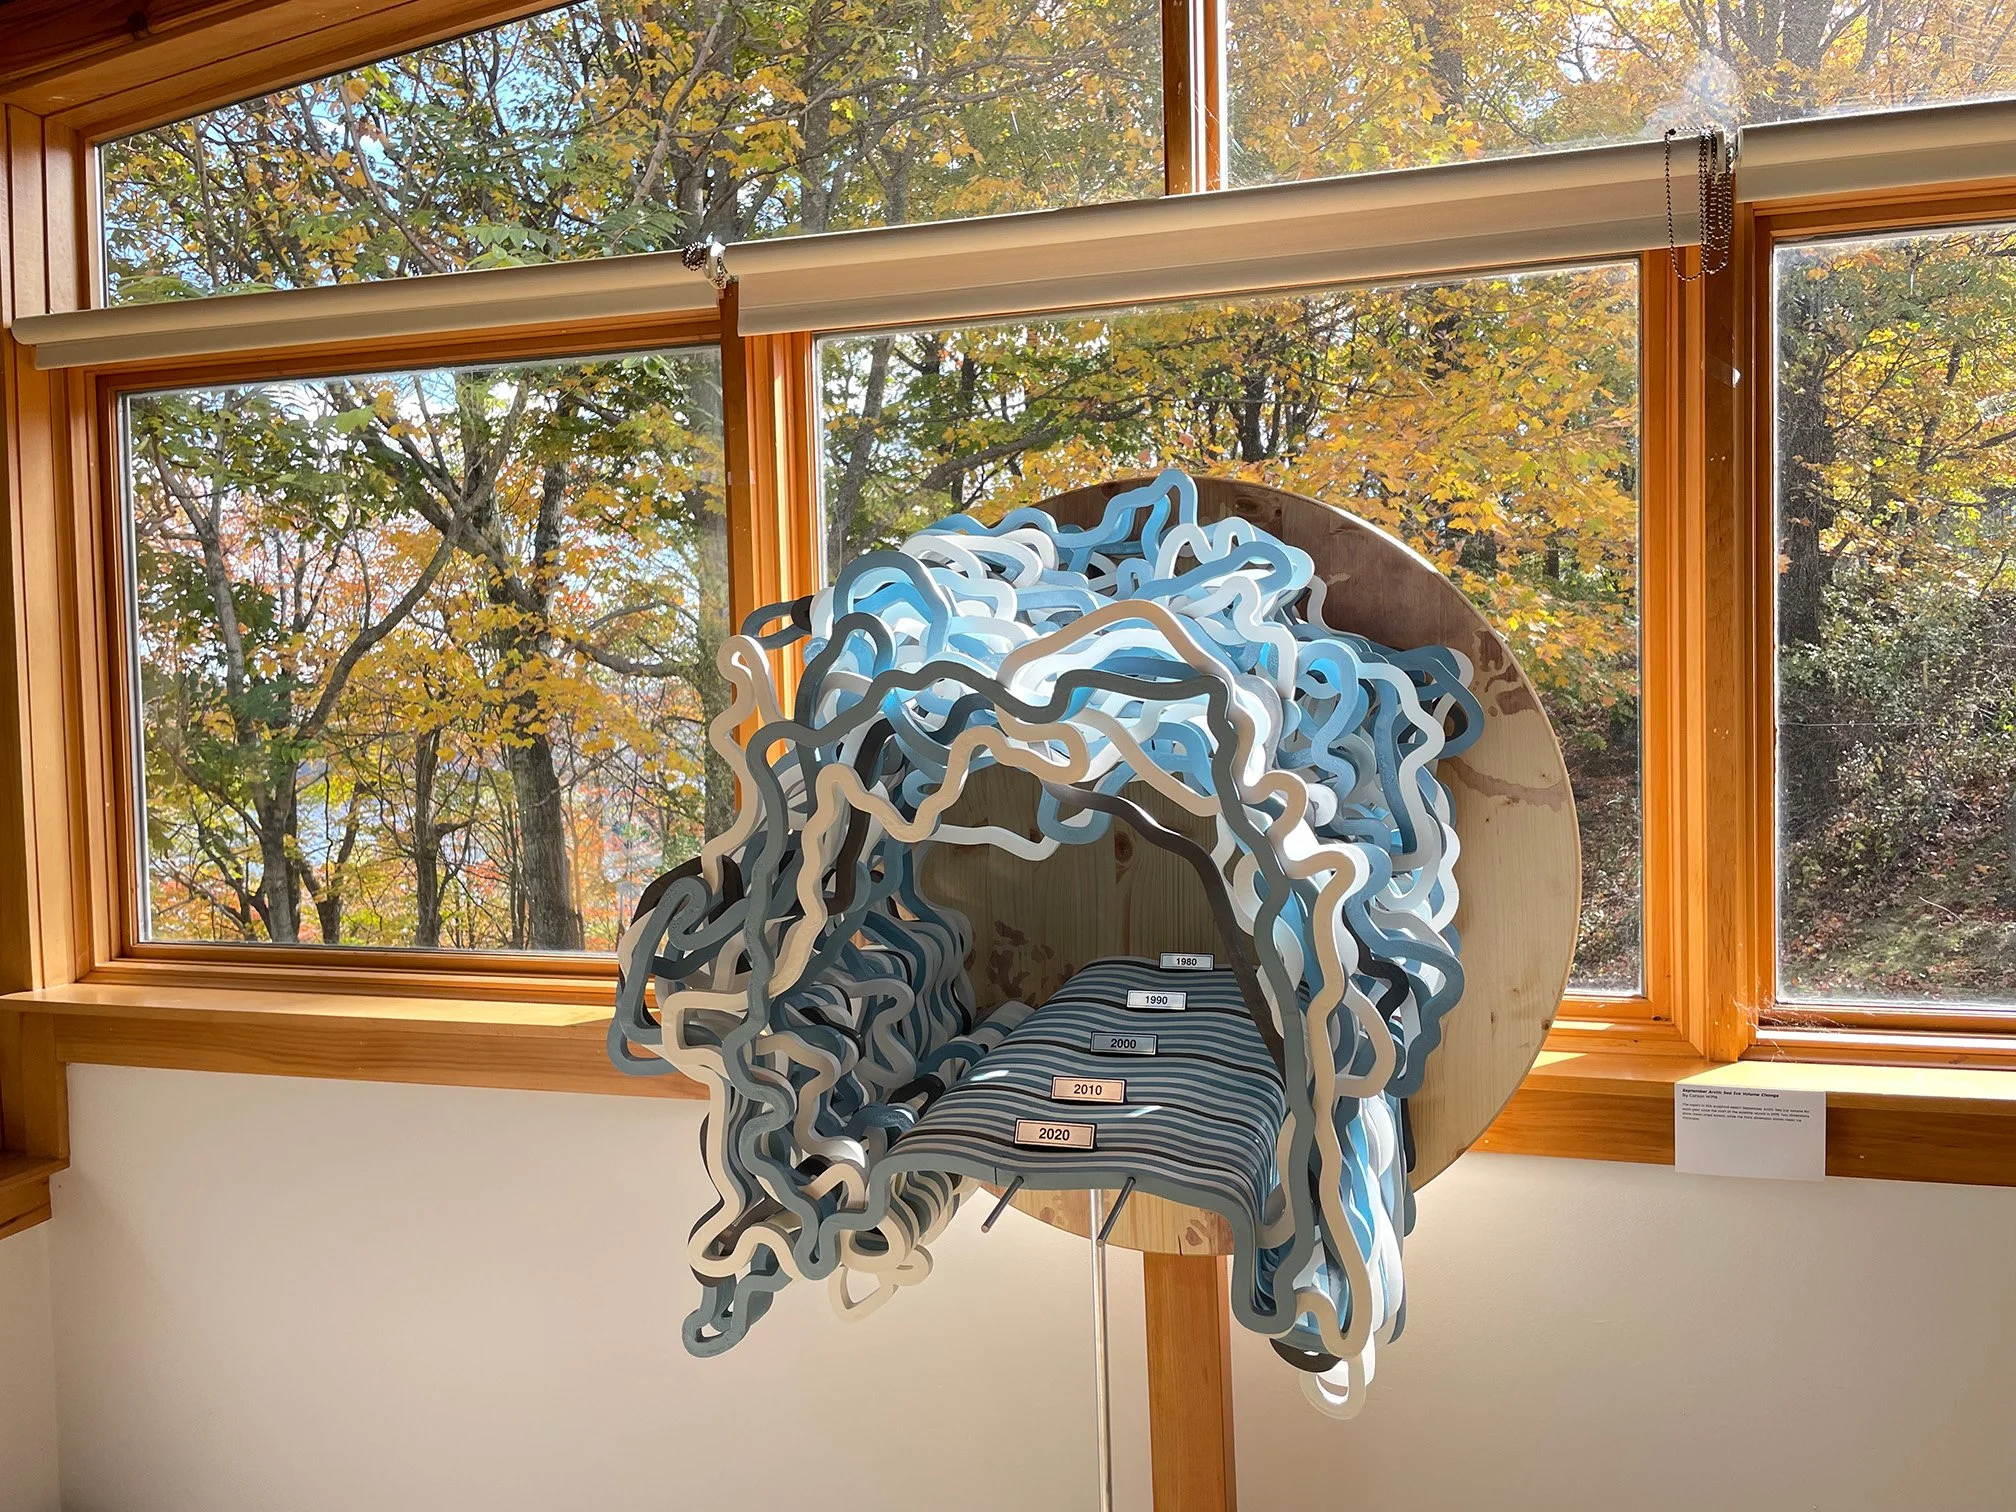
September Arctic Sea Ice Volume Since 1979
The stacked layers of this living sculpture depict maps of the Arctic sea ice pack from every September since the start of the satellite record in 1979, with the thickness of each layer corresponding to the mean thickness of the ice that year, reflecting the total volume change over time. The sea ice reaches a minimum in September, meaning ice that survives through September will likely see another winter. Use of all three spatial dimensions imparts a visceral understanding of the volume loss, conveying both the decadal mean trend and the year-to-year variability in a way that is unachievable in two-dimensional media. Viewers gain new perspectives as they move around the piece, with a straight-on view revealing the loss of areal ice extent, and a side-on view revealing the dramatic decrease in ice thickness. A new layer will be added every year until the ice runs out. This piece was a winner of the 2025 Lamont-Doherty Earth Observatory Research as Art Exhibit, and is currently on display in the Monell building lobby on Lamont campus.
About the Science
This sculpture is a physicalization of scientific data acquired from satellites, ships and submarines. The sea ice extent maps are from NSIDC (Fetterer et al., 2025, doi: 10.7265/a98x-0f50) and the sea ice thickness estimates are from the PIOMAS product (Schweiger et al., 2011, doi: 10.1029/2011JC007084).
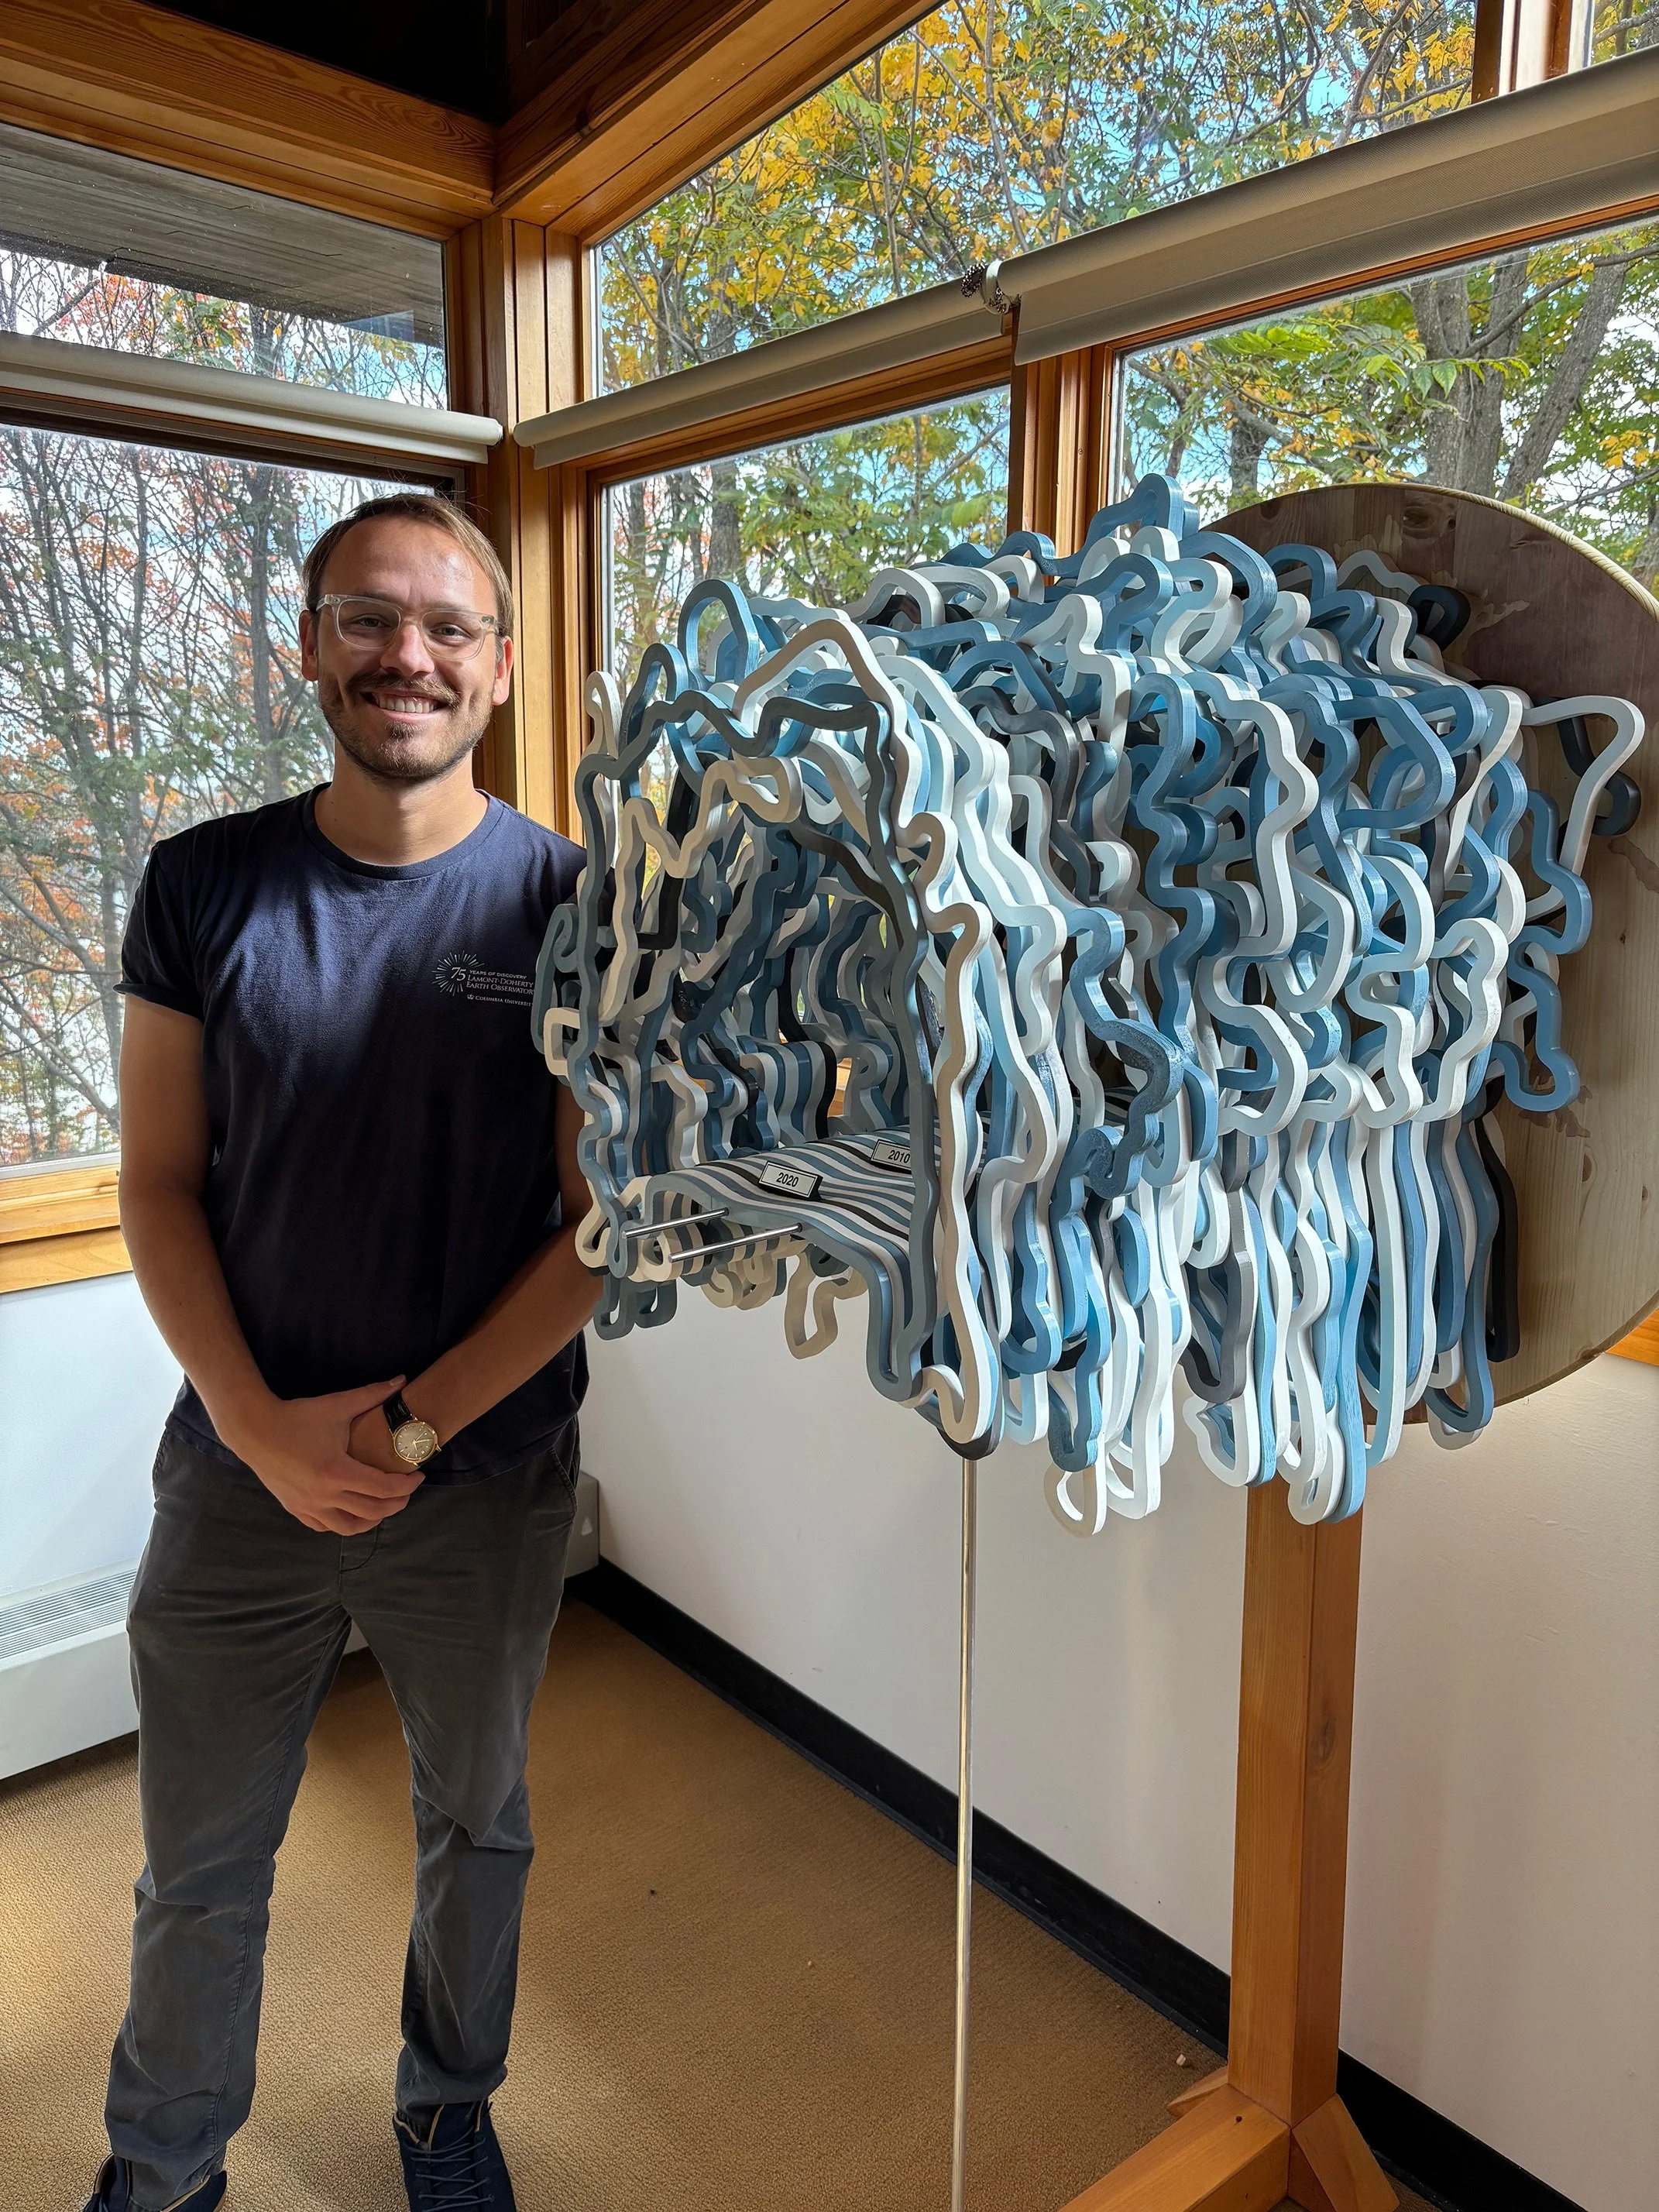
About the Artist
Carson Witte is a Postdoctoral Research Scientist at Lamont-Doherty Earth Observatory of Columbia University. He is an oceanographer specializing in observational studies of air-sea interaction and cryosphere physics, with a passion for community-oriented science and exploration of the boundaries between scientific visualization, artistic expression, and education. This piece is the first in a series of sculptures he is developing to track key physical consequences of climate change as they unfold.